NEET Ug . NEET Zoology . Zoology . Ecosystem
Chapter 12: Ecosystem
Ch 12
NEET Zoology
NEET Ug
Ecosystem-Structure and Function
Ecosystem: Meaning and Types
| Type | Examples |
|---|---|
| Terrestrial natural ecosystems | Forests, grasslands, deserts |
| Aquatic natural ecosystems | Ponds, lakes, wetlands, rivers, estuaries |
| Man-made ecosystems | Crop fields, aquariums |
Ecosystem Structure and Function
Biotic Components
Abiotic Components
Patterns of Ecosystems
| Pattern | Meaning and key points |
|---|---|
| Species composition | The plant and animal species present, identified and counted; it varies with geography, topography and climate. |
| Species composition extremes | Maximum in tropical rainforests and coral reefs; minimum in deserts and Arctic regions. |
| Stratification | Vertical distribution of species across levels; tropical rainforests may have 5–7 strata. |
| Rainforest layers | Emergent tall trees, canopy and under-storey trees; shrubs below the tree layer; herbs and grasses at ground level. |
- The four functional aspects are productivity, decomposition, energy flow and nutrient cycling.
- Together, these processes function as a unit within the ecosystem.
Quick recap
- An ecosystem is a self-regulating unit formed by interacting organisms and their physical environment.
- A.G. Tansley coined “ecosystem” in 1935; Odum emphasised mutual influence between biotic and abiotic components.
- Natural ecosystems are terrestrial or aquatic; crop fields and aquariums are man-made examples.
- Energy enters mainly as solar energy and flows from producers to consumers, while matter cycles between living and non-living components.
- Biotic components are producers, consumers and decomposers; abiotic factors include light, wind, soil, temperature and water.
- Ecosystem structure includes species composition and stratification; key functions are productivity, decomposition, energy flow and nutrient cycling.
Productivity
Meaning and Measurement of Productivity
Primary Productivity
Factors and Biosphere Productivity
- Variation: Primary productivity depends on plant species, environmental factors, nutrient availability and plants’ photosynthetic capacity; therefore, it differs among ecosystems.
- Whole biosphere: Annual NPP is about 170 billion tons of dry organic matter.
- Ocean and land: Oceans cover about 70% of Earth’s surface but contribute 55 billion tons of annual NPP; the remaining 115 billion tons comes from land.
Secondary Productivity
Quick recap
- Productivity measures biomass production per unit area over time.
- Primary productivity is plant production of organic matter; GPP is total production and NPP is what remains after respiration.
- NPP equals GPP minus respiratory use and is available to heterotrophs.
- Primary productivity varies with plant species, environmental conditions, nutrients and photosynthetic capacity.
- Secondary productivity is the rate of food-energy assimilation by consumers, available for transfer to the next trophic level.
- Annual biosphere NPP is about 170 billion tons of dry organic matter: 55 billion tons from oceans and 115 billion tons from land.
Decomposition
Meaning and Importance of Decomposition
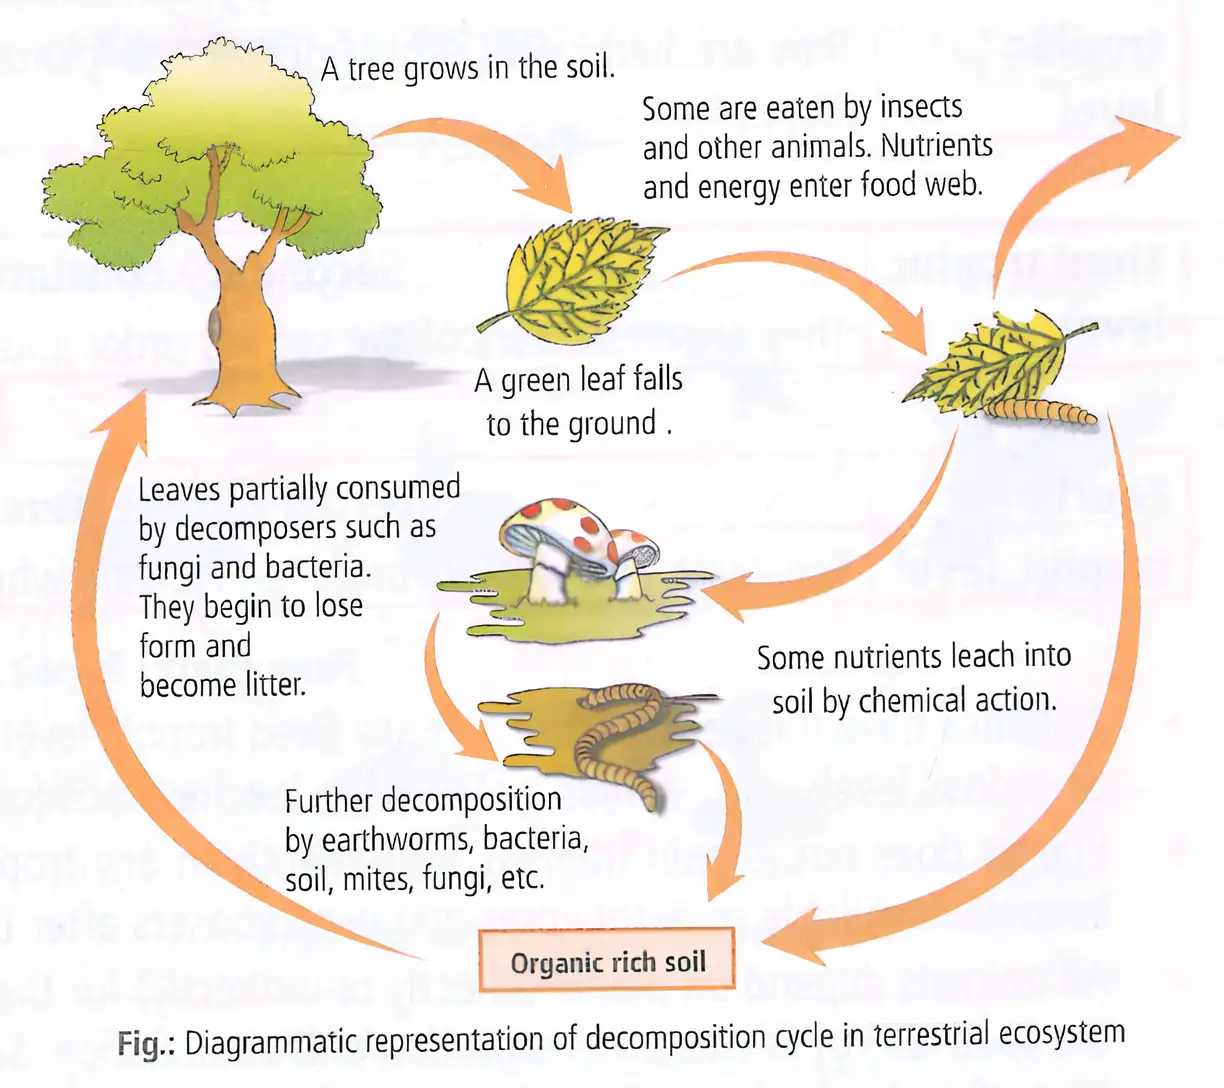
Decomposition — The physical and chemical breakdown of complex organic matter (detritus) into inorganic substances such as carbon dioxide, water and nutrients.
Detritus and the role of decomposition
- Detritus includes dead plant parts (leaves, bark and flowers), dead animals and their remains, and faecal matter.
- Role Decomposition disposes of detritus, recycles biogeochemicals and creates space for new generations of organisms.
- Earthworms are called farmers’ friends because they break down organic matter and loosen the soil.
- Main steps Fragmentation → leaching → catabolism → humification → mineralisation.
| Type | Examples |
|---|---|
| Above-ground | Leaf litter, dried plant parts, animal remains, droppings and excretions |
| Below-ground | Mainly dead roots; also underground dead animals |
Factors Affecting Decomposition
Detritus composition and climate
- Control Decomposition rate depends on the chemical composition of detritus and climatic conditions.
- Slower decomposition Detritus rich in lignin and chitin decomposes slowly under a given climate.
- Faster decomposition Detritus rich in nitrogen and water-soluble substances, such as sugars, decomposes quickly.
- Environmental factors Temperature, moisture and pH affect the rate of decomposition.
Processes Involved in Decomposition
Fragmentation — The breakdown of detritus into smaller particles by detritivores such as termites and earthworms.
- How it occurs Detritus is pulverised as it passes through the digestive tracts of detritivores.
- Result Smaller particles have a greatly increased surface area.
Catabolism — Decomposer enzymes break down complex organic substances into simpler soluble organic compounds and inorganic substances.
- Decomposers Bacteria and fungi secrete digestive enzymes over detritus.
- Assimilation Decomposers take up some of the broken-down food; this material becomes immobilised in them.
Leaching — Percolating water carries soluble substances, such as sugars and nutrients, into deeper soil layers or groundwater.
Humification — The process that leads to the accumulation of humus, a dark-coloured, amorphous substance formed during decomposition.
Properties and importance of humus
- Composition Humus is rich in lignin, cellulose and other resistant substances.
- Persistence It resists microbial action and decomposes extremely slowly; its colloidal nature helps it retain nutrients.
- Soil benefits Humus acts as a nutrient reservoir and helps maintain soil moisture and aeration.
Mineralisation — The further breakdown of humus by microbes, releasing inorganic nutrients.
- Rate Mineralisation is slow because humus is trapped and some nutrients are immobilised in decomposers.
Oxygen and Decomposition
| Condition | Effect on decomposition |
|---|---|
| Aerobic | Oxygen is required for decomposer activity, so decomposition proceeds. |
| Anaerobic | Decomposition is reduced, causing detritus to accumulate. |
Quick recap
- Decomposition converts complex detritus into simpler organic and inorganic substances, recycling nutrients.
- Above-ground and below-ground detritus differ by where the dead material is found.
- Lignin- and chitin-rich detritus decomposes slowly; nitrogen- and sugar-rich detritus decomposes quickly.
- The main steps are fragmentation, leaching, catabolism, humification and mineralisation.
- Humus is resistant, colloidal and nutrient-rich; it supports soil moisture and aeration.
- Aerobic conditions support decomposition, while anaerobic conditions slow it and allow detritus to accumulate.
Energy Flow
Energy Flow in Ecosystems
Energy Flow in Ecosystems
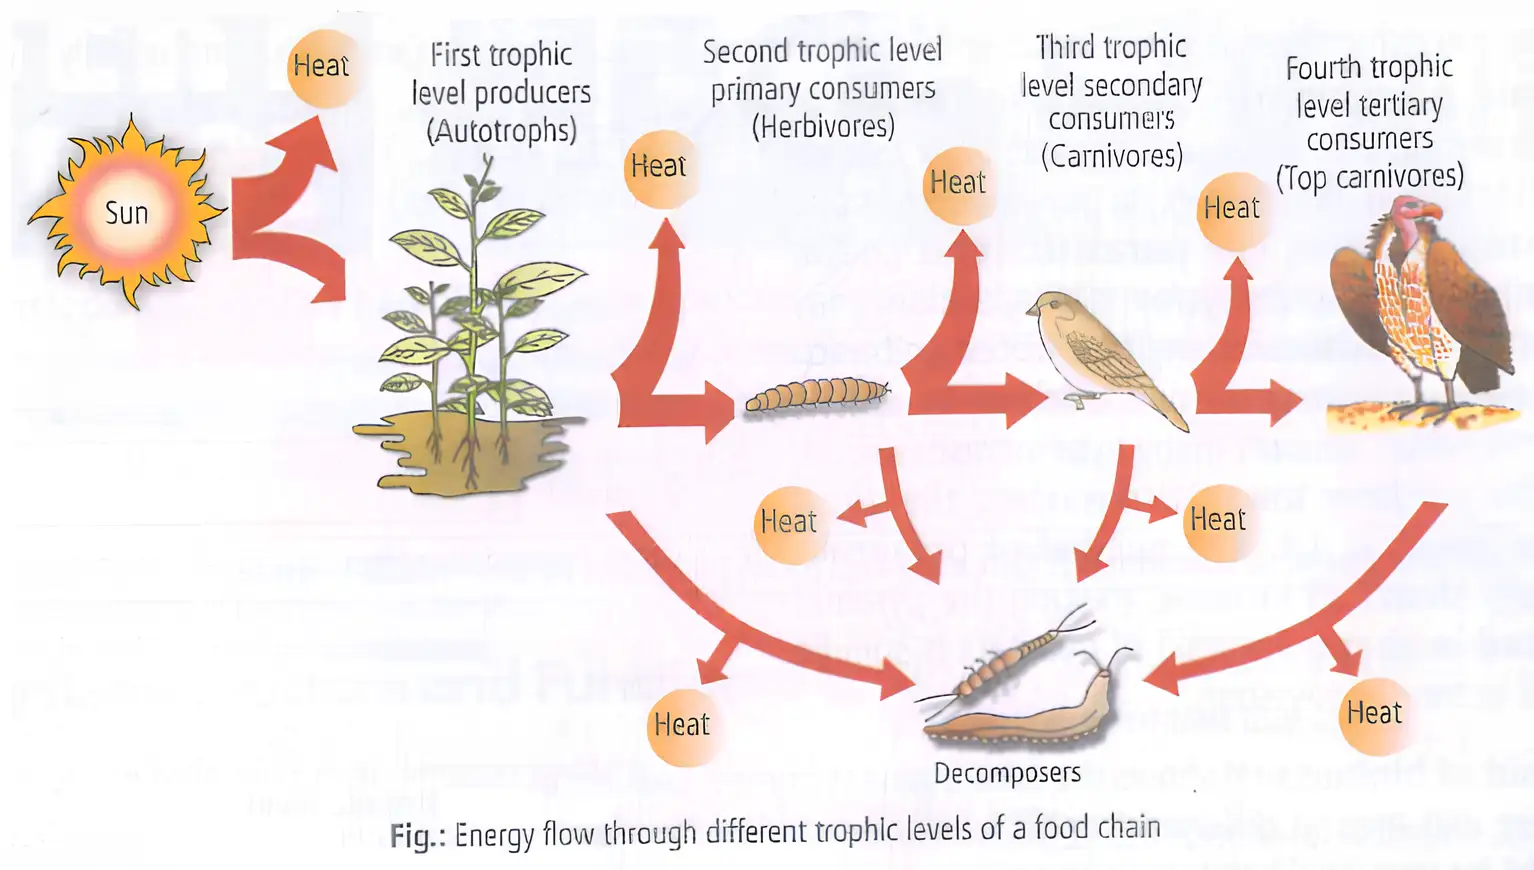
- Energy source: The Sun supplies energy to all ecosystems except deep-sea hydrothermal ecosystems.
- Photosynthetically active radiation (PAR): Less than \(50\%\) of incident solar radiation is PAR; plants and photosynthetic bacteria capture only \(2\text{–}10\%\) of it.
- Dependence on producers: All organisms depend on producers for food, either directly or indirectly; the small amount of captured energy supports the living world.
- Direction: Energy flows unidirectionally from the Sun to producers and then to consumers, in accordance with the first law of thermodynamics.
- Energy loss: The second law of thermodynamics means ecosystems need a constant energy supply to build required molecules and counter increasing disorder; energy is lost as heat.
| Ecosystem | Major producers |
|---|---|
| Terrestrial | Herbaceous and woody plants |
| Aquatic | Phytoplankton, algae and higher plants |
Food Chains and Trophic Levels
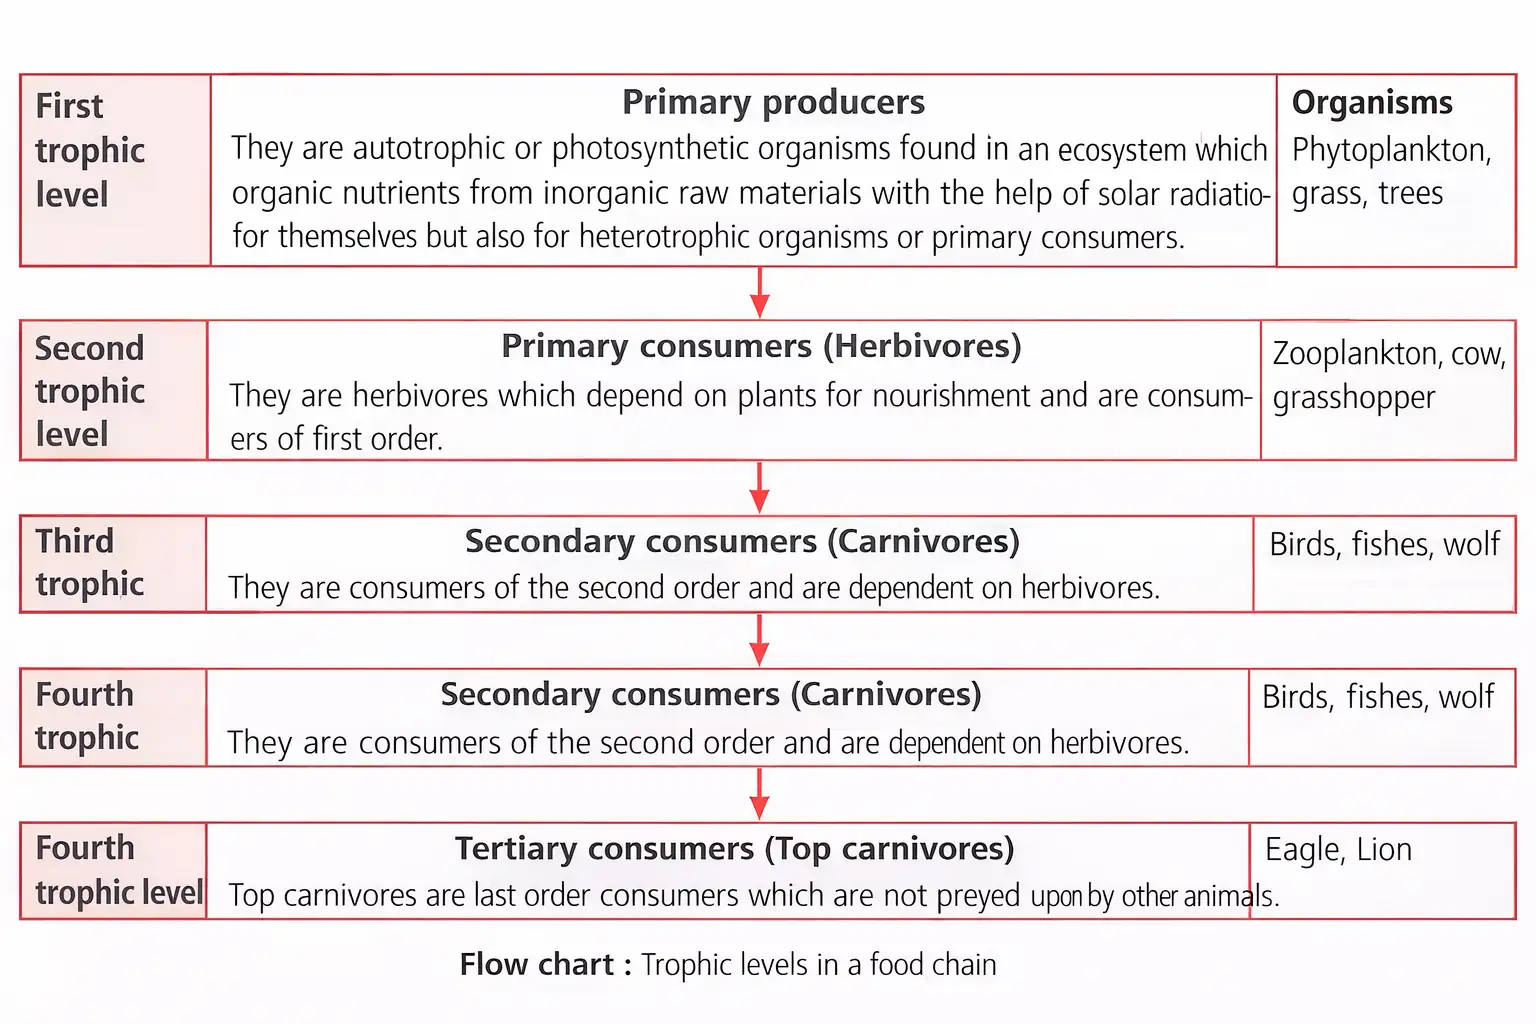
Food chain — A food chain is a sequence through which food, nutrients and energy pass from organism to organism by feeding.
Trophic Levels and Standing Crop
- Food-chain pattern: Usually a straight sequence of populations related by eating and being eaten; a chain commonly has \(3\text{–}6\) trophic levels.
- Trophic level: A feeding position in a food chain, identified by how an organism obtains food; the number of levels equals the number of steps in the chain.
- Multiple levels: Some organisms, such as humans, can occupy more than one trophic level.
- Progressive decrease: Available energy, biomass and number of individuals generally decrease as trophic level rises; much energy is lost as heat at each transfer.
- Standing crop: The living biomass or number of organisms per unit area in an ecosystem or trophic level; dry weight is preferred because fresh weight varies with seasonal moisture.
- Support: Producers sustain food chains, while decomposers use dead organic matter and help sustain the system.
Energy Transfer Between Trophic Levels
- Parasites: They do not occupy one fixed trophic level because they may feed on producers, herbivores or carnivores; examples include aphids, ticks, mites, leeches and mosquitoes.
- After death: Energy does not remain trapped at a trophic level; it passes to a higher level through feeding or becomes available to detritivores and decomposers.
- Energy use by herbivores: Some food is lost through digestion and assimilation; some assimilated food is broken down to release energy for body activities, and only a small portion becomes body tissue.
- Transfer onward: Herbivores may be eaten by primary carnivores, then by secondary carnivores and higher consumers; a large share of energy is lost as heat at each step.
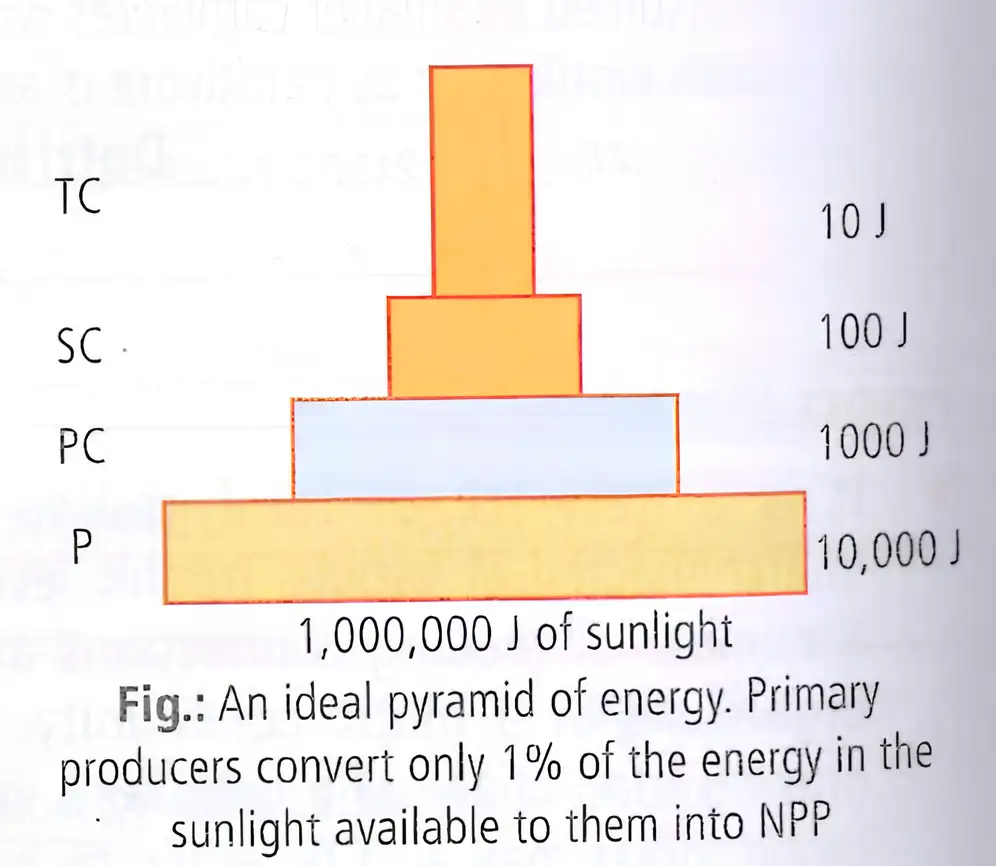
Lindeman’s 10% law — Proposed by Lindeman in 1942: only about \(10\%\) of the energy available at one trophic level passes to the next.
If \(E_n\) is the energy at level \(n\), the next level receives about \(10\%\) of it.
Implications of the 10% Law
- Producer biomass: A large amount of biomass at the producer level is needed to support organisms at higher trophic levels.
- Chain length: With a given initial energy supply, shorter food chains can support greater biomass and are more efficient; chains with fewer links are favoured.
Types of Food Chain
| Type | Begins with / pattern | Example | Key point |
|---|---|---|---|
| Grazing food chain (GFC) | Producers → consumers | Grass → Goat → Man | Most common; also called predator food chain because predation occurs at each step. Includes producers, consumers and decomposers. |
| Parasitic food chain (PFC) | Host → parasite; usually ends with a parasite | Host followed by its parasites | Also called auxiliary food chain; parasites and scavengers operate through these chains. |
| Detritus food chain (DFC) | Detritus → detritivores and decomposers → consumers | Detritus → Earthworm → Sparrow → Falcon | Begins with dead organic matter; detritivores and decomposers that feed on it are saprotrophs. |
Detritus Food-Chain Alternative
- Another pathway: Detritus → Earthworm → Frog → Snake → Peacock.
Food Web
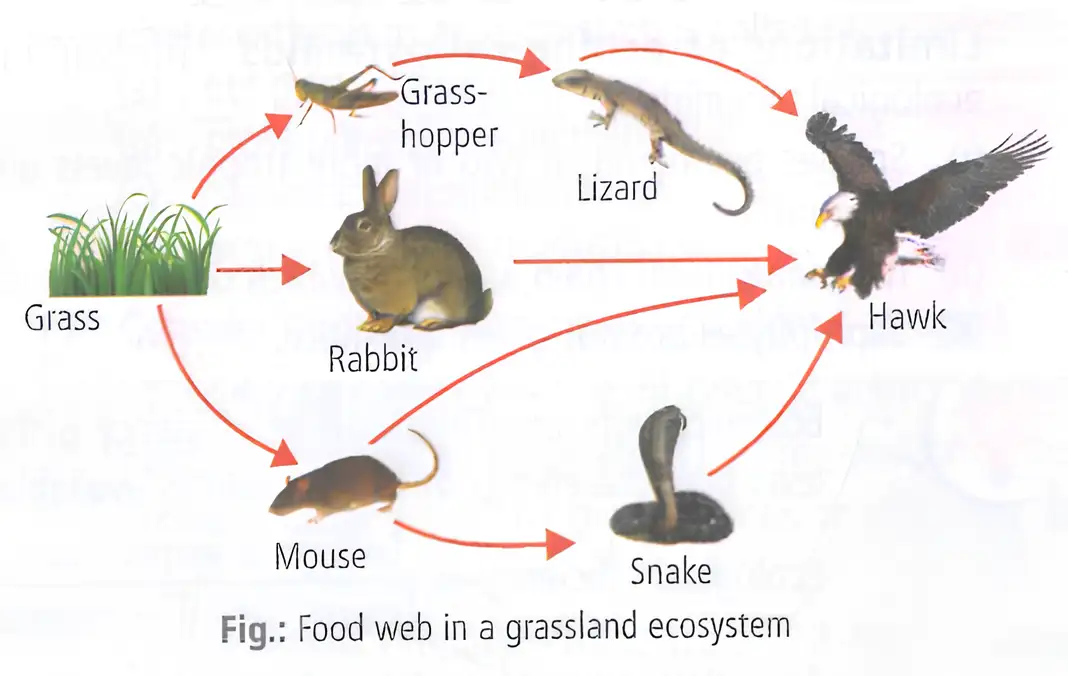
Food web — A network of food chains interconnected at different trophic levels, forming multiple feeding relationships in a community.
Food-Web Connections and Stability
- Grassland example: If rabbits are absent, mice may eat grass; hawks may eat mice directly or eat snakes that have eaten mice.
- Stability: Alternative feeding links in a food web help maintain ecosystem stability.
State Lindeman’s 10% law and one implication.
How does a food web help maintain ecosystem stability?
Quick recap
- The Sun is the energy source for ecosystems except deep-sea hydrothermal ecosystems; autotrophs capture only a small fraction of PAR.
- All organisms depend on producers directly or indirectly, and energy flows one way through producers to consumers.
- Trophic levels are feeding positions; standing crop is measured preferably by dry weight.
- Lindeman’s 1942 law states that about \(10\%\) of energy passes to the next trophic level.
- Grazing, parasitic and detritus food chains begin with producers, hosts and detritus, respectively.
- Food webs connect food chains and their alternative feeding links help stabilise ecosystems.
Ecological Pyramids
Ecological pyramids and trophic levels
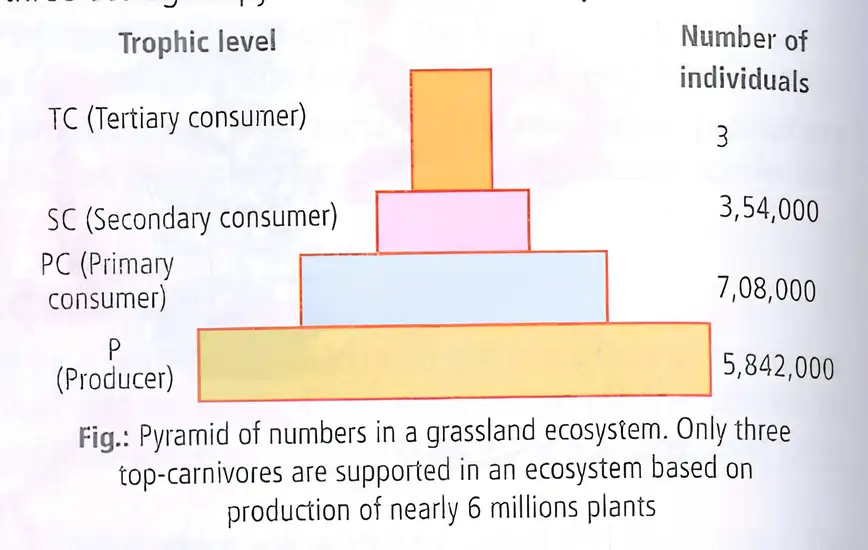
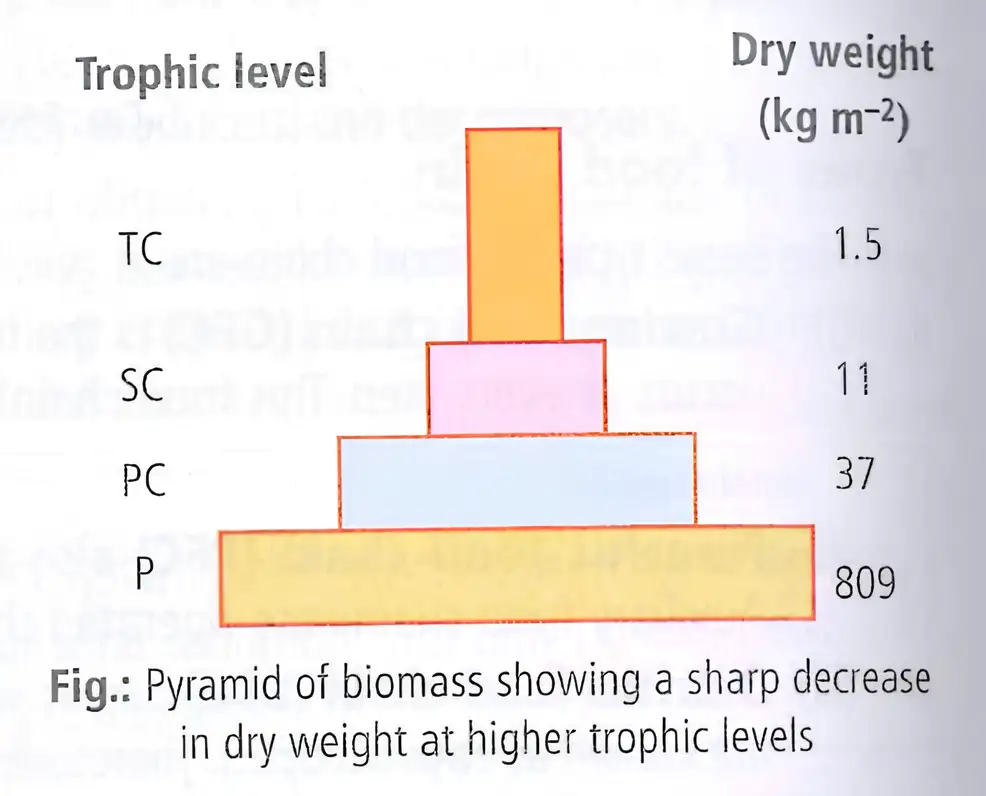
Ecological pyramid — A graphical representation of organisms at successive trophic levels in terms of number, biomass or energy.
- Structure: Producers form the base; tertiary or top-level consumers occupy the apex.
- Origin: Ecological pyramids were developed by Charles Elton in 1927; they are also called Eltonian pyramids.
- Calculations: Include all organisms at a trophic level when calculating their number, biomass or energy.
- Trophic level: A functional feeding position, not a species identity; one species may occupy multiple levels.
- Example: A sparrow is a primary consumer when eating seeds or fruits, but a secondary consumer when eating insects or worms.
Types of ecological pyramids
| Pyramid | What it shows | Shape and examples |
|---|---|---|
| Numbers | Number of individual organisms per unit area at each trophic level. | Usually upright in grassland and pond ecosystems; spindle-shaped in forests; inverted in parasitic food chains on trees. |
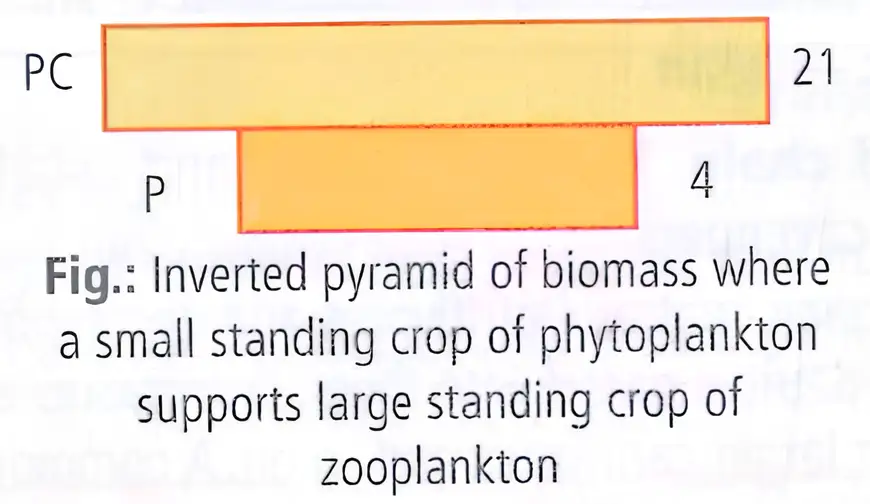
| Biomass | Total biomass per unit area at successive trophic levels. | Upright in terrestrial habitats; inverted in aquatic ecosystems. |
| Energy | Rate of energy flow and/or productivity per unit time and area at successive trophic levels. | Always upright because energy content decreases at each successive trophic level. |
Why pyramid shapes differ
- Numbers—tree food chain: One tree can support many herbivores; each herbivore may support several parasites, which may support many hyperparasites. Numbers increase toward consumers, producing an inverted pyramid.
- Numbers—forest: The pyramid is spindle-shaped.
- Biomass—aquatic ecosystem: Small producers such as phytoplankton have low standing biomass but support a larger zooplankton biomass; the pyramid is inverted.
- Energy: Energy declines from producers to consumers at every successive trophic level, so the pyramid cannot be inverted.
Limitations of ecological pyramids
- Multiple trophic levels: Species occupying two or more trophic levels are not represented adequately.
- Oversimplified food chains: Pyramids treat feeding relationships as simple food chains, unlike complex natural food webs.
- Saprophytes: They are not given a place in ecological pyramids.
Ecological and production efficiencies
Ecological efficiency (trophic-level efficiency) — The percentage of energy in food resources at a lower trophic level that is converted into biomass at the next trophic level.
Here, \(E_c\) is energy converted into biomass at a trophic level, and \(E_l\) is energy in biomass at the lower trophic level.
Assimilation efficiency — The percentage of ingested food energy assimilated for body building.
Here, \(E_a\) is food energy assimilated for body building, and \(E_i\) is total food energy ingested.
Photosynthetic efficiency — The percentage of incident solar radiation converted into chemical energy by producers during photosynthesis.
GPP means gross primary productivity; use its energy relative to incident solar radiation.
Net production efficiency — The percentage ratio of net primary productivity to gross primary productivity.
NPP means net primary productivity; GPP means gross primary productivity.
Why is the pyramid of energy always upright?
Why can the pyramid of biomass be inverted in an aquatic ecosystem?
Quick recap
- Ecological pyramids represent numbers, biomass or energy across trophic levels; Charles Elton developed them in 1927.
- A trophic level is a functional position, and one species may occupy more than one level.
- Numbers pyramids may be upright, inverted or spindle-shaped; biomass pyramids are upright on land and inverted in aquatic habitats.
- Energy pyramids are always upright because energy decreases at each successive trophic level.
- Pyramids omit species at multiple trophic levels, oversimplify food chains and exclude saprophytes.
- Ecological, assimilation, photosynthetic and net production efficiencies are expressed as percentage ratios.
NEET Zoology — ALL CHAPTERS
1
Structural Organisation in Animals
2
Breathing and Exchange of Gases
3
Body Fluids and Circulation
4
Excretory Products and their Elimination
5
Locomotion and Movement
6
Neural Control and Coordination
7
Human Reproduction
8
Reproductive Health
9
Evolution
10
Microbes in Human Welfare
11
Organism and Population
12
Ecosystem
13
Biodiversity and Conservation